🔈Design bunker edges, without limits. Check out the new Edgevantage now.


🔈Design bunker edges, without limits. Check out the new Edgevantage now.


Every bunker and every sand arena starts with a sand analysis report. Most superintendents and arena owners receive one before they buy, and most find it hard to read.
Reports come in different formats. Some list the percentage of sand passing through each sieve, others the percentage retained. Some use millimeters, others US mesh numbers or inches. Even experienced professionals need time to compare one report with another, or with a recommended range.
The quickest way to understand a sand is to see its gradation curve next to the range you are aiming for. This guide explains how to read the numbers behind that curve, using two real reports. It also shows how the free CapillaryFlow Sand Agent draws the curve for you in seconds.
This is the companion to our guide on how to choose the right bunker sand. That guide covers what to look for. This one covers how to check it.
A sieve analysis shakes a dried sample through a stack of sieves, from coarse at the top to fine at the bottom. The lab then weighs what is left on each sieve. There are two ways to report that same result.
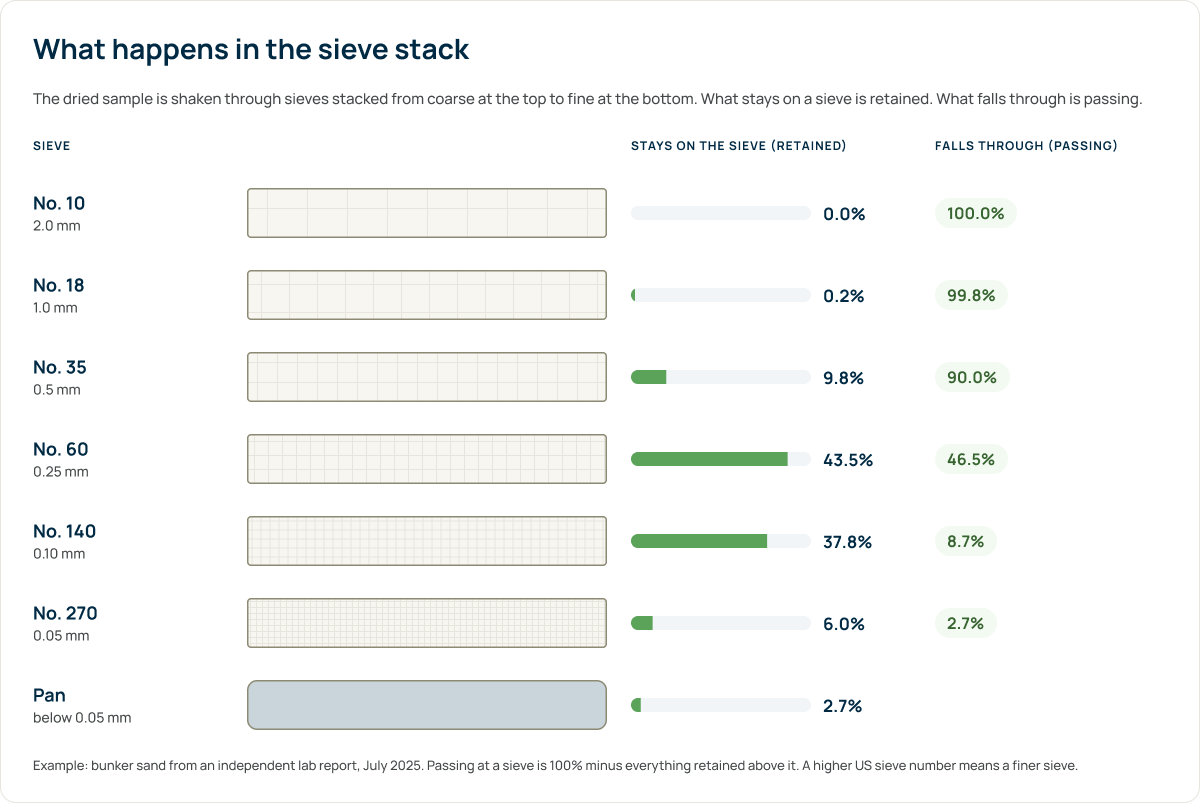
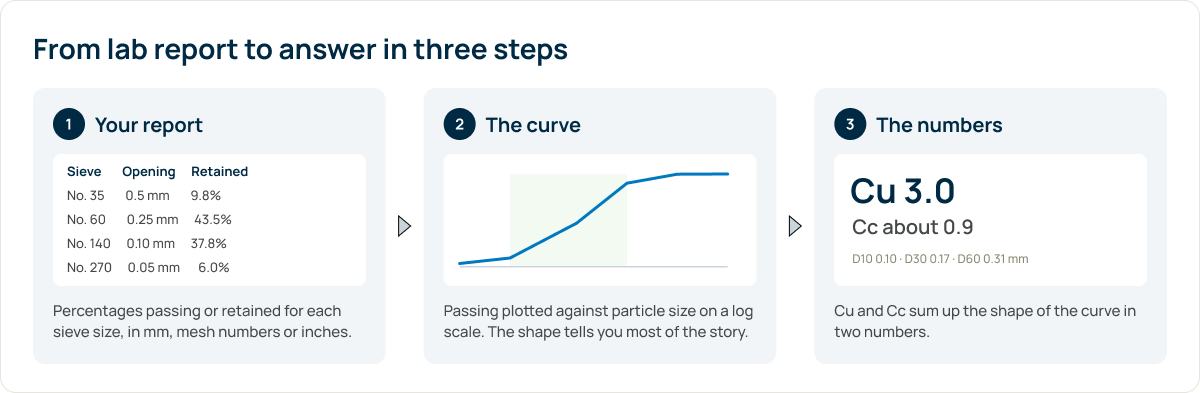
To turn retained into passing, start at 100% and subtract each retained value as you move down to finer sieves. Table 1 shows this for a real bunker sand, using the size classes in the lab report.
Table 1. Sand particle size distribution determined by sieve analysis, showing the percentage of material retained on and passing through each sieve.
| US sieve no. | Opening (mm) | Size class | Retained (%) | Passing (%) |
|---|---|---|---|---|
| 10 | 2.0 | Gravel above 2.0 mm | 0.0 | 100.0 |
| 18 | 1.0 | Very coarse sand | 0.2 | 99.8100 − 0.2 |
| 35 | 0.5 | Coarse sand | 9.8 | 90.099.8 − 9.8 |
| 60 | 0.25 | Medium sand | 43.5 | 46.590.0 − 43.5 |
| 140 | 0.10 | Fine sand | 37.8 | 8.746.5 − 37.8 |
| 270 | 0.05 | Very fine sand | 6.0 | 2.78.7 − 6.0 |
| n/a | below 0.05 | Silt and clay | 2.7 | n/a |
Retained adds up to 100%. Passing starts at 100% and drops by the retained share at each sieve. Source: independent lab report for a golf club bunker sand, July 2025.
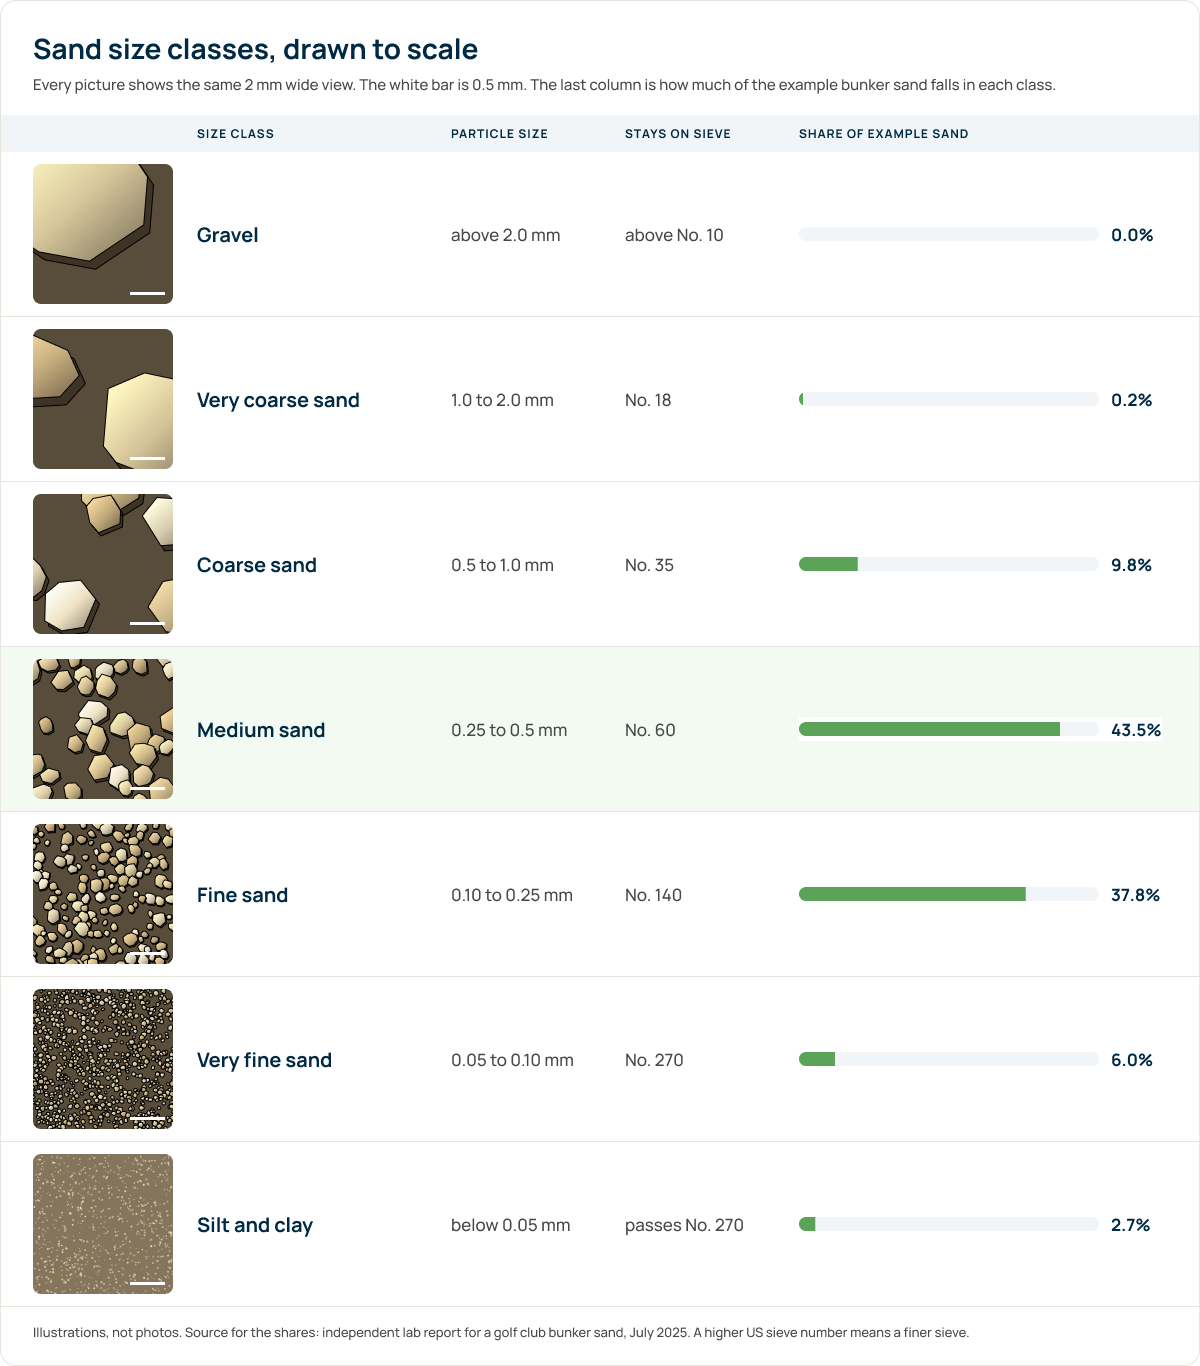
The second difference is in the units used. U.S. laboratories often identify sieves by mesh number, which refers to the number of openings per linear inch, with higher mesh numbers indicating finer sieve openings. European labs usually give the opening in millimeters or micrometers. Some reports also give inches. A No. 60 sieve, a 0.25 mm sieve and a 250 µm sieve are the same sieve.
| US mesh (No.) | Millimeters | Micrometers | Inches |
|---|---|---|---|
| No. 10 | 2.0 mm | 2,000 µm | 0.079 in |
| No. 18 | 1.0 mm | 1,000 µm | 0.039 in |
| No. 35 | 0.5 mm | 500 µm | 0.020 in |
| No. 60 | 0.25 mm | 250 µm | 0.0098 in |
| No. 140 | 0.10 mm | 100 µm | 0.0039 in |
| No. 270 | 0.05 mm | 50 µm | 0.0020 in |
Same sieve, four names. A higher mesh number means a finer sieve. Sizes are the nominal values used in the lab report.
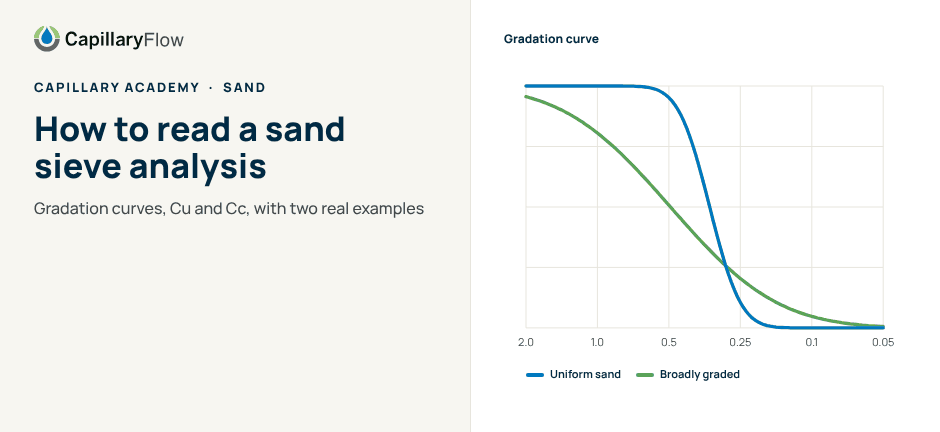
The gradation curve plots the passing percentages against particle size. Particle size runs along the x-axis on a logarithmic scale while the percentage passing or retained runs along the y-axis.
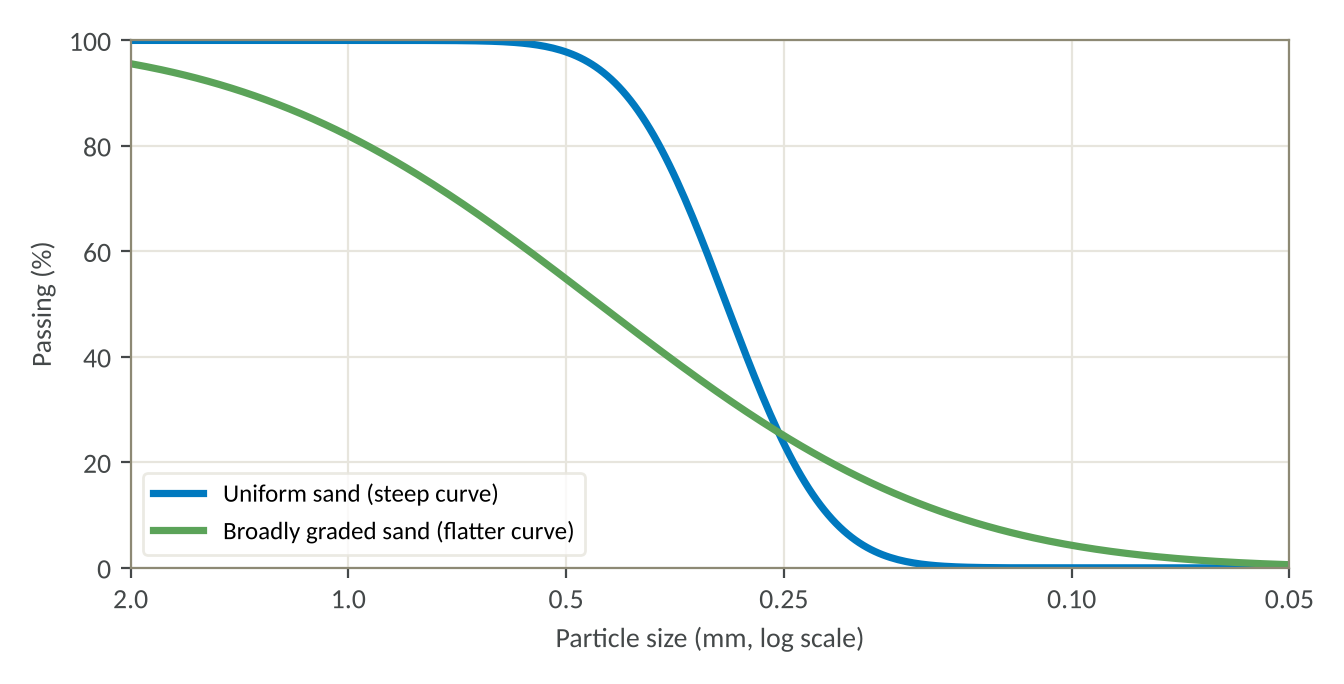
Figure 1. Sample particle size distribution curves for a uniform sand and a broadly graded sand.
Three things are worth reading straight off the curve:
A recommended range is drawn as two curve envelopes. If your curve stays within the envelope, the particle sizes match that range. A distribution curve does not describe grain shape, mineral content, color or how the sand will behave once it has been played on for a few seasons. These characteristics require further laboratory analysis.
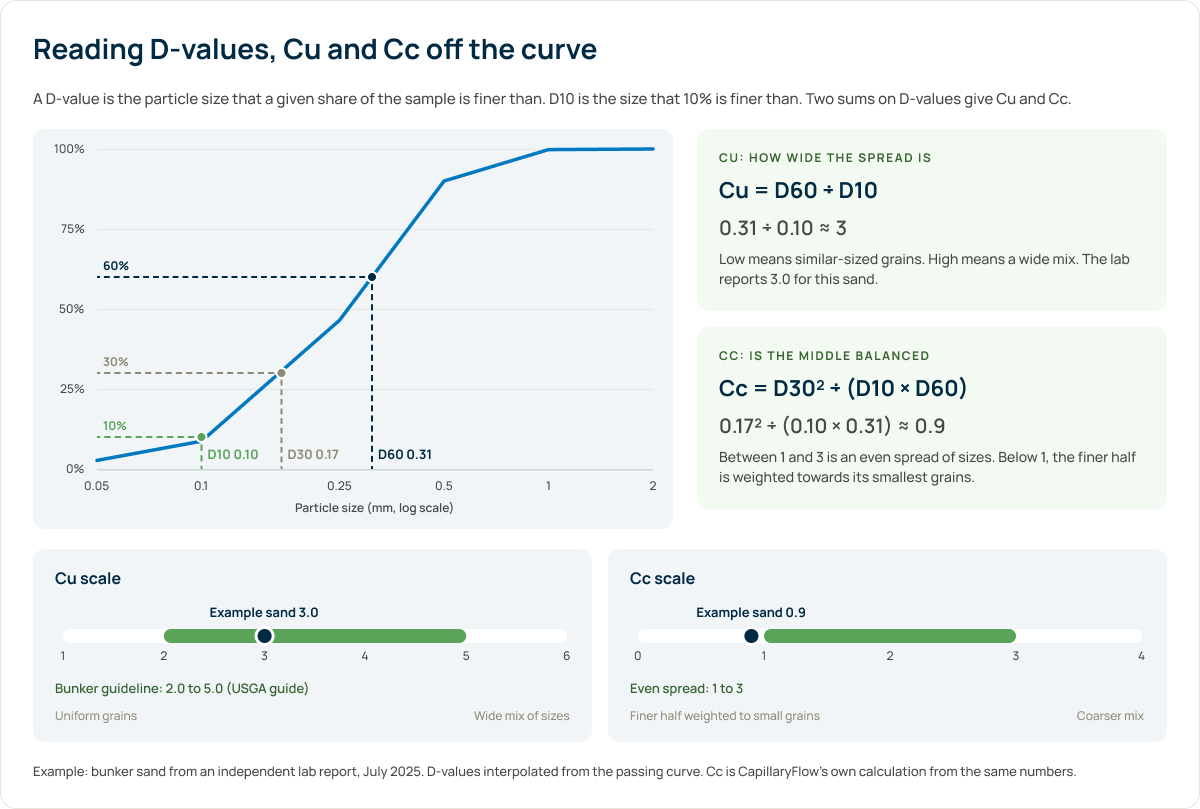
Two numbers sum up the shape of the curve. Both use D-values: the particle size at which a given percentage of the sample passes. D10 is the size that 10% of the sample is finer than. D60 is the size that 60% is finer than.
Cu, the coefficient of uniformity, tells you how wide the spread of grain sizes is.
Cu = D60 ÷ D10
A low Cu means the grains are similar in size. A higher Cu means a wider mix, so smaller grains fill the gaps between larger ones. In bunkers, the lab behind our bunker example notes that a higher Cu, within the recommended size ranges, generally gives firmer conditions than a more uniform sand. In arenas, a sand that is too uniform can lack grip, while too wide a mix compacts and gets hard.
Cc, the coefficient of curvature, tells you whether the middle of the curve is balanced.
Cc = D30² ÷ (D10 × D60)
Soil engineers read a Cc between 1 and 3 as an even spread of sizes. Below 1 means the finer half of the sample is weighted towards its smallest grains. Cc is less common on bunker and arena reports, but it helps when you compare two sands with a similar Cu.
Neither number replaces the curve. Two sands can share a Cu and still sit in very different size ranges, which is why the curve comes first. The CapillaryFlow Sand Agent calculates Cu and Cc for you from your gradation curve.
Saturated hydraulic conductivity is the rate water moves down through a saturated, compacted sample, usually reported in inches or millimeters per hour. Labs measure it in a column of sand, and it depends mostly on the finest part of the curve: a few percent more particles under 0.25 mm can cut it sharply.
The USGA suggests at least 20 inches (about 500 mm) per hour for bunker sand, and notes that sands starting at 30 to 100 inches per hour generally work well. The bunker sand in our example below measured 11.3 inches per hour, mainly because of its fine and very fine sand. The CapillaryFlow Sand Agent will estimate hydraulic conductivity directly from your gradation curve, as a first check before the lab test.
Saturated hydraulic conductivity, inches per hour. The example sand is below the minimum because of its share of particles under 0.25 mm.
The USGA does not publish an official specification for bunker sand. What it does publish is a recommended particle size range for building putting greens. This is the range the CapillaryFlow Sand Agent uses for golf, because it is the most widely accepted reference curve in the industry.
A putting green and a bunker serve different purposes. A putting green's root zone is designed to resist compaction, provide adequate drainage, and support healthy turfgrass growth. A bunker shares similar objectives regarding drainage and stability but does not need to support turfgrass roots. It also must drain fast, support a ball without plugging, stay on the faces, and play the same from bunker to bunker.
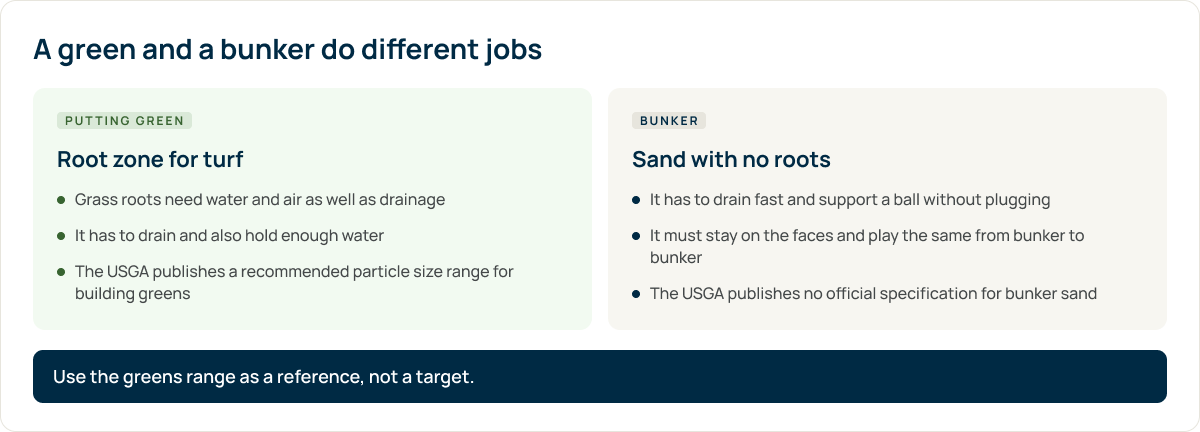
The putting greens sand ranges should be treated as a reference, not a target. For bunkers, labs typically assess sand against separate criteria, such as those by Brown and Thomas (1986) used in our bunker example and summarized in the USGA's guide to selecting bunker sand. They include no more than 3% silt and clay. The principles behind those numbers matter more than any single curve:
Field infiltration of bunker sand, inches per hour, as cited by the USGA. Contamination, wash-down from faces and grains breaking down add fines over time.
The same applies to arenas. Equestrian Surfaces: A Guide, from the Swedish Equestrian Federation and SLU, calls a sieve analysis a start, but not enough on its own, and recommends asking an expert or analyzing the sand in an arena you know works well. It quotes arena consultants who work to about 2 to 4% filler, the material finer than 0.063 mm, and a maximum of about 5% for fiber and wood mixes.
This is also where CapillaryFlow comes in. In bunkers and arenas built with the Capillary system, the Capillary Wash Box removes particles below 0.05 mm from the installed sand, without removing it. All it takes is a hose from the irrigation system, and the sand's gradation moves back towards its original curve.
This sand was tested in July 2025 against the bunker criteria by Brown and Thomas (1986). Figure 2 gives passing percentages by size class, which we converted from retained values in Table 1.
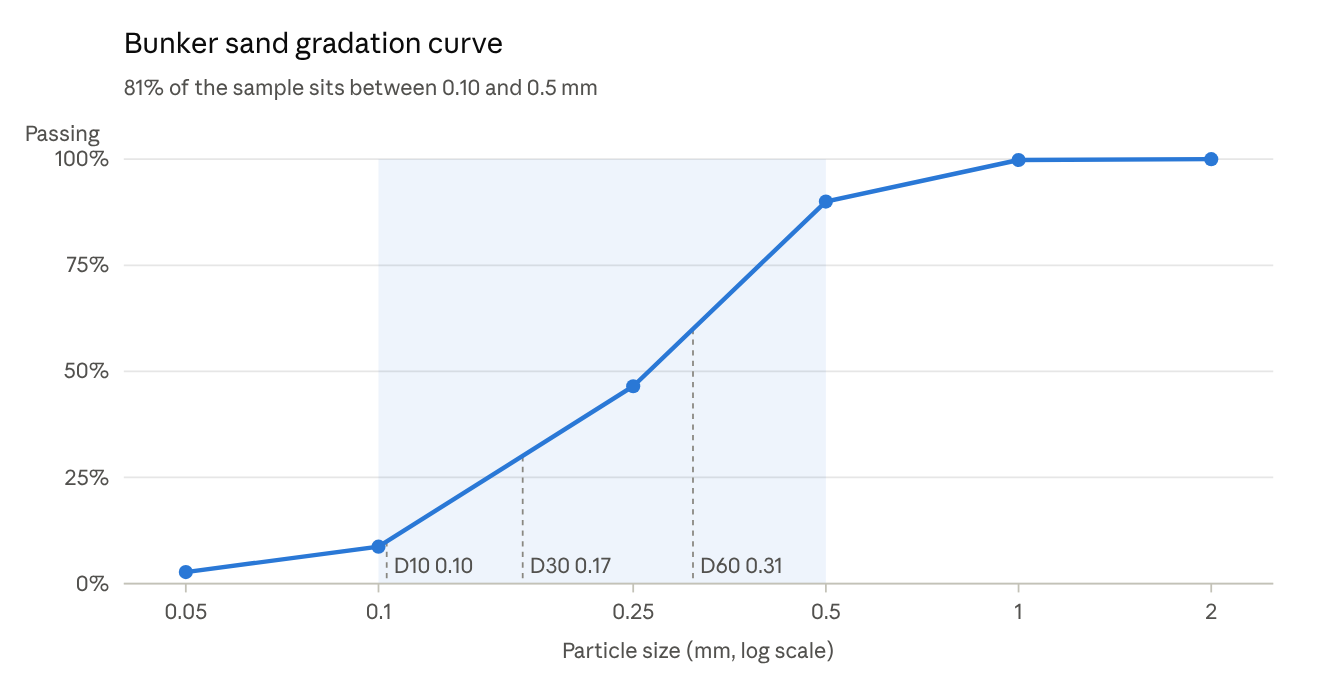
Figure 2. Particle size distribution of a North American golf course bunker sand, expressed as cumulative percent passing.
Reading the report and the curve together:
| Check | This sand | Reference | Result |
|---|---|---|---|
| Steep part of the curve | 43.5% medium + 37.8% fine sand | Medium to fine | Fine side |
| Very fine sand (0.05 to 0.10 mm) | 6.0% | Max 5% | Over |
| Silt and clay (below 0.05 mm) | 2.7% | Max 3% | Within |
| Cu and Cc | Cu 3.0 (lab), Cc about 0.9 | Even spread: Cc 1 to 3 | Fairly uniform |
| Drainage | 11.3 in/hr (287 mm/hr) | Min 20 in/hr | Below |
Bunker sand from an independent lab report, July 2025, tested against the Brown and Thomas criteria. Cc is CapillaryFlow's own calculation (D10 0.10, D30 0.17, D60 0.31 mm).
The curve alone would have told you most of this in seconds: a sand on the fine side with a tail of very fine particles that will slow drainage. The lab's shape and infiltration tests complete the picture.
For an equestrian arena project in Greece, the supplier's sieve analysis was entered into the first version of the CapillaryFlow Sand Agent calculator (Table 2). This report used US mesh numbers and grams retained.
Table 2. Equestrian sand particle size distribution determined by sieve analysis, showing the percentage of material retained on and passing through each sieve.
| US sieve no. | Opening (mm) | Retained (%) | Passing (%) |
|---|---|---|---|
| 16 | 1.0 | 0.3 | 99.7100 − 0.3 |
| 30 | 0.5 | 11.5 | 88.299.7 − 11.5 |
| 50 | 0.25 | 62.8 | 25.488.2 − 62.8 |
| 100 | 0.15 | 24.3 | 1.125.4 − 24.3 |
| 200 | 0.075 | 1.1 | 0.01.1 − 1.1 |
Retained adds up to 100%. Source: supplier sieve analysis for an equestrian arena project in Greece.
Reading it:
A sand that is this uniform has poor compactibility and thus, holds together poorly. Therefore, for any sand, its grip and stability depend heavily on its moisture content. For this reason, the uniformity and consistency of wetting the sand matter just as much as the sand itself.
Sources: independent lab report, July 2025; supplier sieve analysis for an arena project in Greece, January 2025. D-values interpolated from the passing curves.
If your bunkers already drain badly, you can test the sand before you send anything to a lab. Our free Bunker Problem Solving Kit has four simple checks you can run with sand from the bottom of your bunkers:
The CapillaryFlow Sand Agent is a first check only. The recommended ranges are based on industry experience and do not guarantee how a sand will perform. Results must be confirmed with an accredited soil testing laboratory or your sand supplier before you order or install any sand. CapillaryFlow accepts no responsibility for decisions made on the basis of the calculator's results.
The CapillaryFlow Sand Agent reads your sand analysis report in seconds. Upload the report or type in the values, in metric or imperial, passing or retained. It draws your gradation curve against the right range for your sand and calculates Cu and Cc. Every analysis is saved, so you can compare suppliers.
Upload your report and see the curve against the right range.
Open the CapillaryFlow Sand AgentRead more: How to choose golf bunker sand · Sand for horse arenas: how to choose · Managing sand moisture · Capillary Wash Box
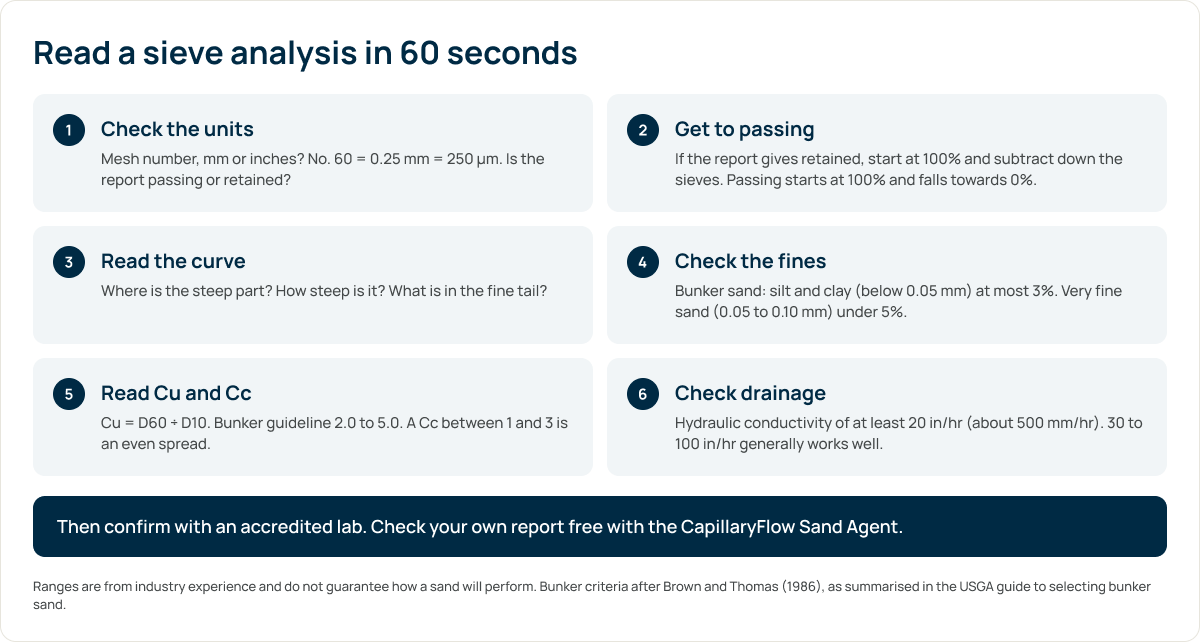
A standard physical test covers particle size (the sieve analysis) and usually grain shape. For bunker sand, labs often add infiltration rate and color. For root zone sand, they add porosity, water retention and hydraulic conductivity.
Use a physical soil testing lab that works with golf and sports turf. Labs typically follow ASTM F1632 for particle size and sand shape. Your supplier may also have a recent report for the sand you are buying, which is a good first check.
Take small samples from several places, such as several bunkers or across the whole arena, and mix them into one. For a new sand, ask for a sample from the batch you will actually receive.
Before you buy, and again when bunkers start to drain slowly or play differently. Fines build up after installation, so a sand that tested well on delivery can fall outside the range within a few seasons.
You can run simple checks on site: a jar test for fines and an infiltration test with compacted sand. Our Bunker Problem Solving Kit includes both. They show whether there is a problem. A lab test shows why.
No. It reads the lab or supplier report you already have, draws the curve and calculates Cu and Cc, so you can compare sands quickly. Grain shape, infiltration and chemistry still need a lab.
The sieve analysis is the same, but the results are compared against different ranges. Bunker sand is judged on drainage and plugging. Arena sand is judged on support and grip, which depend on moisture as much as on particle size.